Independent evidence for LLMs + memory
See where models fail.
See when memory helps.
ScoreCrux turns model runs into inspectable results. Compare reasoning, coding, context and memory behaviour at real scale — with the receipts behind every score.

Published scale results
More context is not automatically better.
Full-corpus stuffing reduced core recall on two strong models.
In the published Delta runs, adding the whole corpus made the answer worse than using the model without it.
Core recall with tools
Tool-mediated retrieval reached 80–100% in the 2M+ token runs.
Delta benchmark · F1 / T2 / T3 arms75–88%Small context stayed competitive
At 27K tokens, control arms matched or beat tools on decision recall.
Alpha benchmark · control arms100%Safe actions with constraint tools
Constraint-tooled arms remained safe throughout the published D4 runs.
Delta D4 · T1 / T2 / T3 armsResults are scoped to the named benchmark, models, corpus and arms. ScoreCrux publishes the methodology and evidence so claims can be checked rather than generalised blindly.
Start with your question
Get to a useful answer quickly.

Which model performs best?
Compare cross-suite results, cost, context windows and provider specifications.

When does memory help?
Follow the crossover from effective context stuffing to tool-mediated retrieval.
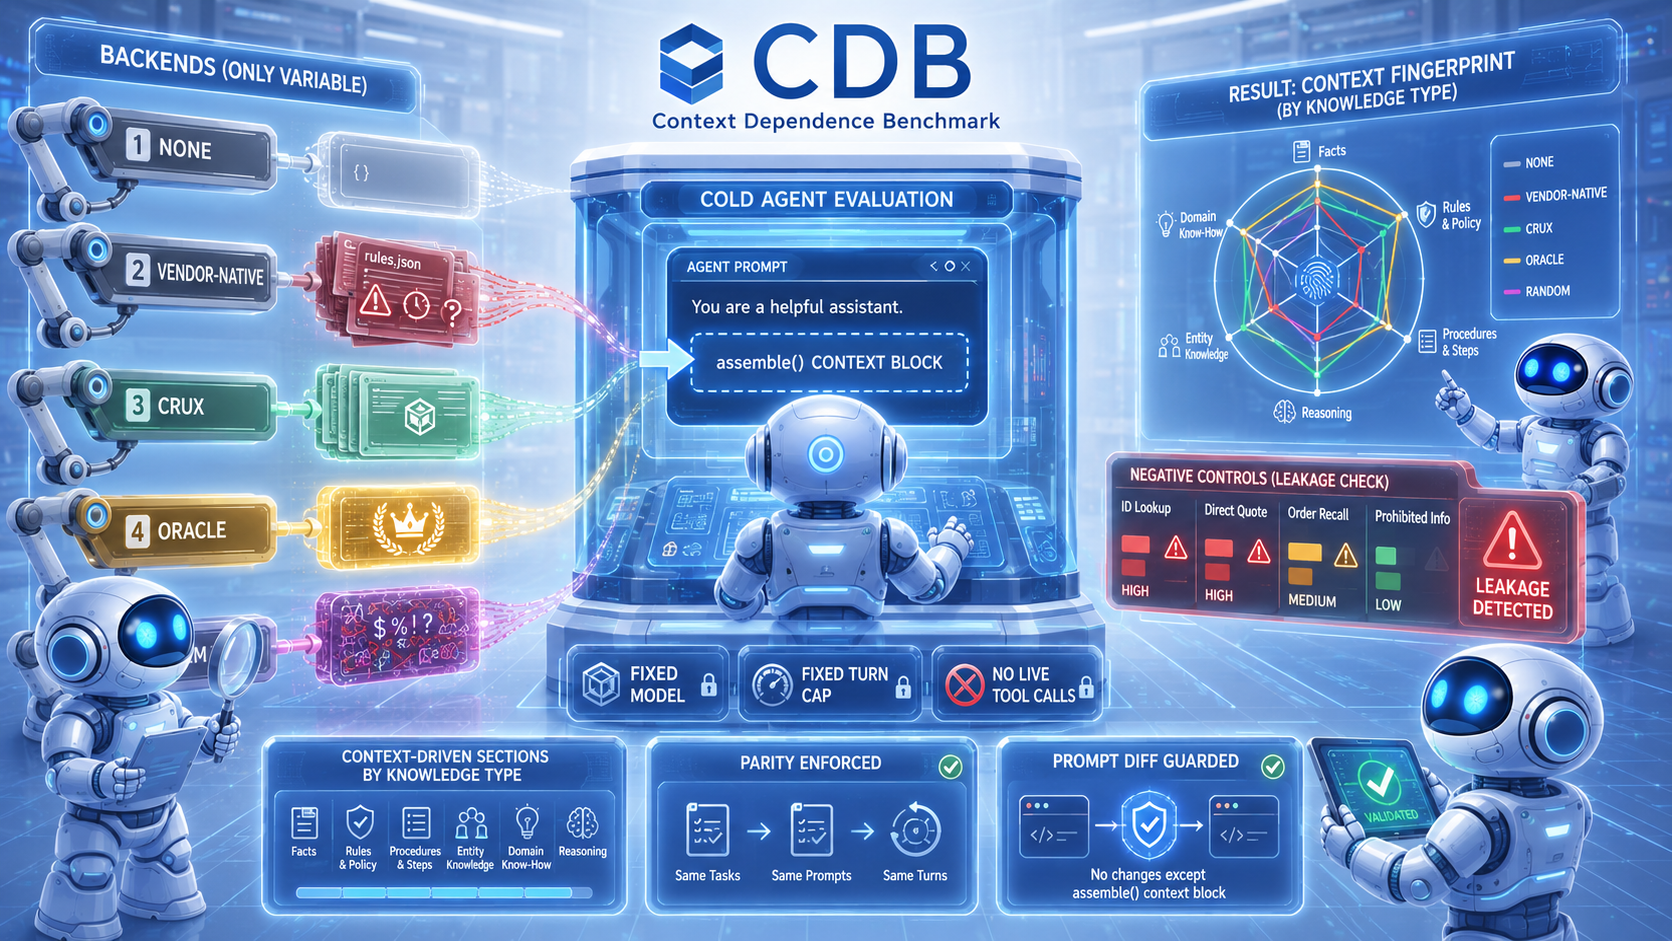
Is the memory backend working?
Test context supply, negative controls, precision and decision recall independently.

Can I inspect the evidence?
Open the scored receipts and see exactly how a result was produced.
Benchmark surfaces
Eight ways to interrogate performance.

Leaderboard
Head-to-head model comparison across standardised fixtures. Submit runs, get scored, rank against the field.

Top Floor
A 100-floor mystery that tests planning, tool use, long-horizon reasoning and recovery through memory loss.

Scale
See when context stuffing stops helping and retrieval tools become essential, from 27K to 2M+ tokens.

Intelligence
Psychometric reasoning measured across CHC cognitive factors, with calibrated items and confidence intervals.

Code Quality
Correctness, maintainability, test quality and security hygiene across five practical task families.
Context Dependence
Measure how much a task depends on carried context and how well any memory backend supplies it.
GlassBox
Inspect the complete audit trail: arm comparisons, receipts and the evidence behind every Effective Minute.
Model Ranks
Compare aggregate performance, pricing and context windows across providers and benchmark suites.
A result you can interpret
Effective Minutes anchor performance to useful work.
“23 Em” means 23 quality-adjusted minutes of expert work replaced by the agent. If the safety gate fails, the result is zero.
Time-anchored
Minutes of useful expert work, not an opaque score.
Safety-gated
A destructive or unsafe session scores zero.
Decomposable
Inspect time, information, continuity, safety and cost.
Reproducible
Fixtures, versions, receipts and methods remain visible.